
Grafana dashboards for microservices on Kubernetes
Grafana without dashboards is an empty screen. In this article I describe two dashboards I configure for the portfolio project: one based on Prometheus metrics from nginx-ingress, the other on Loki logs. Both load automatically from a ConfigMap in Kubernetes.
Automatic import via sidecar
The kube-prometheus-stack Helm chart installs Grafana with a sidecar container that watches ConfigMaps with the grafana_dashboard=1 label. All you need is a ConfigMap with the dashboard JSON:
kubectl create configmap grafana-dashboards -n monitoring \
  --from-file=portfolio-services.json \
  --from-file=loki-logs.json

kubectl label configmap grafana-dashboards -n monitoring grafana_dashboard=1
The sidecar detects the change and imports the dashboard without restarting Grafana. Updating means kubectl delete configmap + re-create + label.
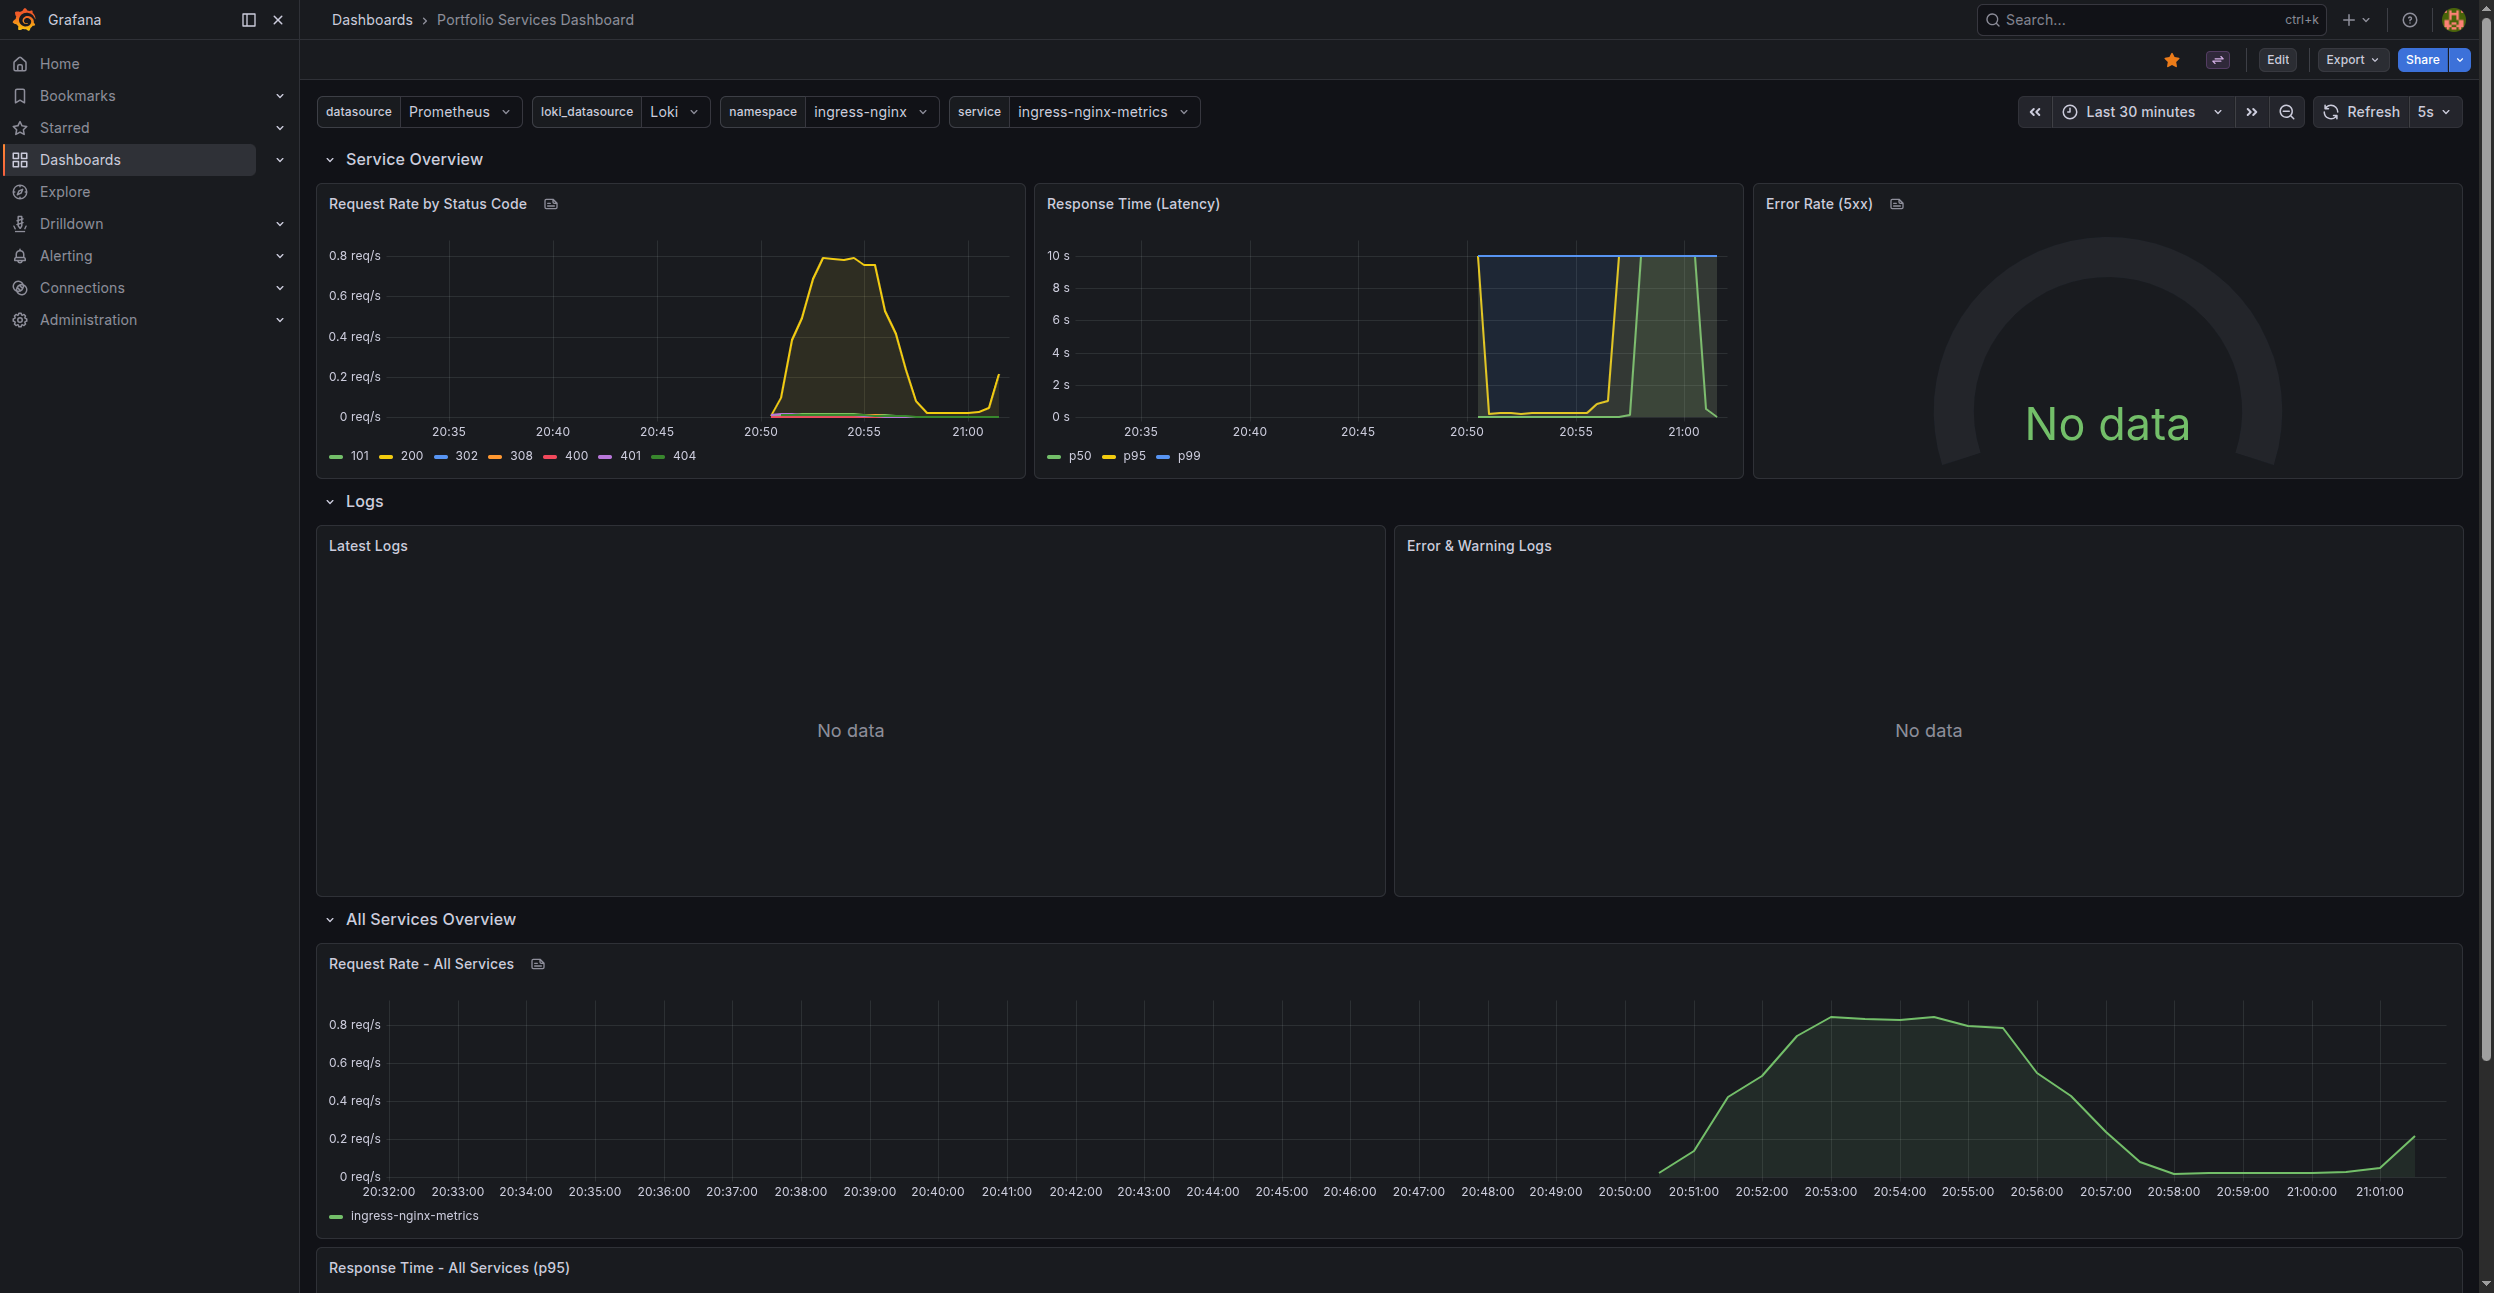
Dashboard 1: Portfolio Services
A dashboard for monitoring HTTP traffic flowing through the nginx-ingress controller. It consists of three sections.
Template variables
Two variables allow filtering across all panels:
{
  "name": "namespace",
  "definition": "label_values(nginx_ingress_controller_requests,namespace)",
  "type": "query"
},
{
  "name": "service",
  "definition": "label_values(nginx_ingress_controller_requests{namespace=~\"$namespace\"},service)",
  "type": "query"
}
namespace pulls the list of namespaces where nginx-ingress registers traffic. service filters dynamically by the selected namespace. In practice I select portfolio and see frontend, blog, sso, analytics.
Request Rate by Status Code
sum(rate(nginx_ingress_controller_requests{
  service=~"$service",
  namespace=~"$namespace"
}[5m])) by (status)
rate() over 5 minutes smooths out noise. Grouping by (status) splits the chart into lines for 200, 301, 404, 500, etc. A timeseries panel with reqps unit.
Response Time (Latency)
Three percentiles in one panel:
# p50
histogram_quantile(0.50, sum(rate(
  nginx_ingress_controller_response_duration_seconds_bucket{
    service=~"$service", namespace=~"$namespace"
  }[5m])) by (le))

# p95
histogram_quantile(0.95, ...)

# p99
histogram_quantile(0.99, ...)
histogram_quantile requires grouping by (le) — that is the histogram bucket label. p50 is the median, p95 shows what 95% of users experience, p99 catches outliers.
Error Rate (5xx)
sum(rate(nginx_ingress_controller_requests{
  service=~"$service", namespace=~"$namespace",
  status=~"5.."
}[5m]))
/
sum(rate(nginx_ingress_controller_requests{
  service=~"$service", namespace=~"$namespace"
}[5m]))
The ratio of 5xx to all requests. A gauge panel with a threshold at 5% (turns red). A NaN value means no traffic — that is normal.
Logs in the dashboard
Two Loki log panels embedded in the same dashboard:
# Latest Logs
{namespace=~"$namespace", app=~"$service"}

# Error & Warning Logs
{namespace=~"$namespace", app=~"$service"}
  |~ "(?i)(error|exception|fatal|fail|warning)"
A logs panel displays a real-time log stream. The |~ filter is regex in LogQL.
All Services Overview
The bottom section — request rate and p95 latency for all services at once:
sum(rate(nginx_ingress_controller_requests{
  namespace=~"$namespace"
}[5m])) by (service)
Stacking mode: "normal" shows each service's share of total traffic.
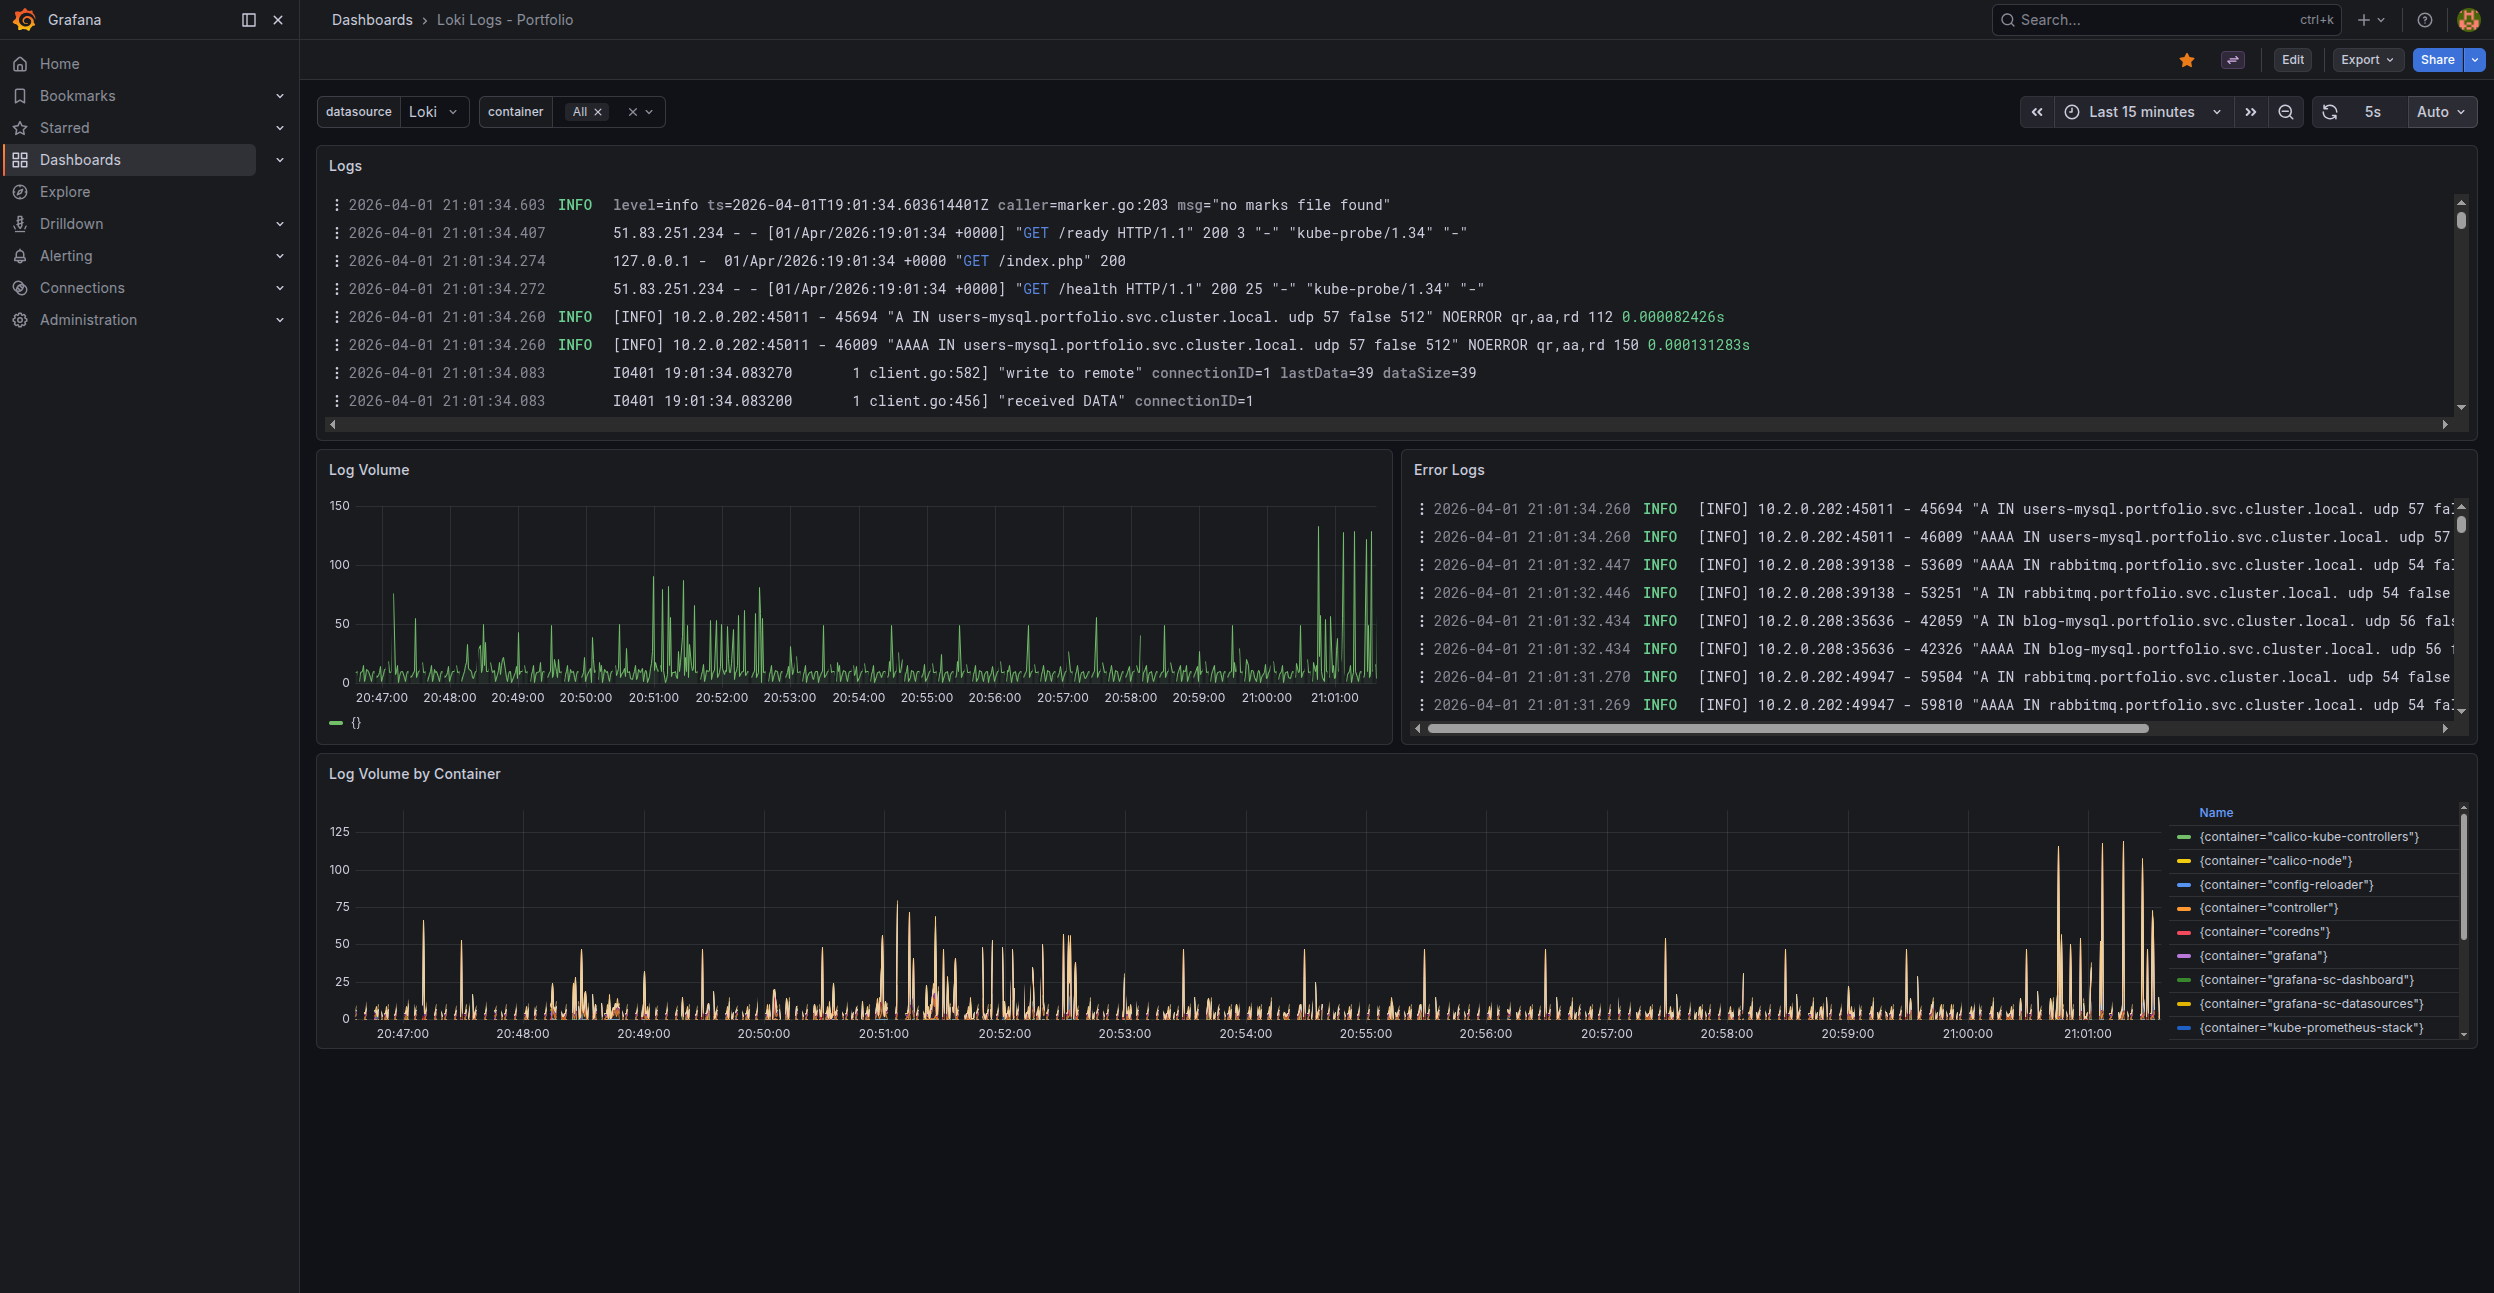
Dashboard 2: Loki Logs — Portfolio
A dashboard for browsing Loki logs. Four panels, one container variable.
Container variable
{
  "name": "container",
  "definition": "label_values({job=\"kubernetes-pods\"}, container)",
  "type": "query"
}
Pulls the list of containers from Loki. Lets you pick e.g. frontend-app, blog-app, sso-app.
Logs
{container=~"$container"}
A raw log stream from the selected container. A logs panel with automatic refresh.
Log Volume
sum(count_over_time({container=~"$container"}[$__interval]))
A bar chart with log count per interval. $__interval adjusts automatically to the time range. A spike on the chart means something is happening.
Error Logs
{container=~"$container"} |~ "(?i)(error|exception|fatal|fail)"
A filtered stream — only lines containing errors. A fast way to spot problems without digging through thousands of info/debug lines.
Log Volume by Container
sum by (container) (count_over_time({container=~".+"}[$__interval]))
An overview of logging activity across all containers. Lets you quickly see which service generates the most logs — often pointing to a problem or unnecessary debug logging.
Updating a dashboard
The editing workflow:
- Edit the dashboard in Grafana (GUI)
- Export the JSON: Settings → JSON Model → Copy
- Save to
grafana/dashboards/*.jsonin the repository - Update the ConfigMap in Kubernetes
- The sidecar automatically imports the change
Alternatively: edit the JSON directly and update the ConfigMap. The dashboard appears in Grafana without touching the GUI.